
 |
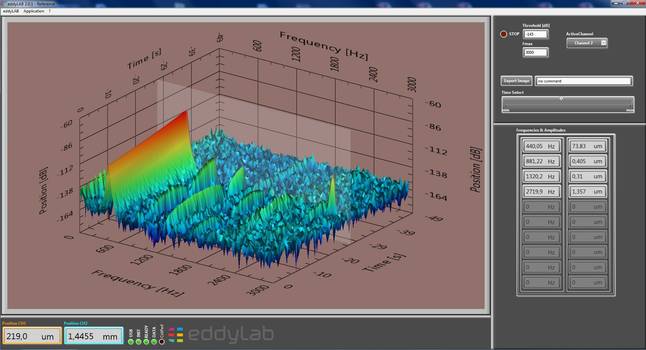
| Waterfall of a tuning fork |
The waterfall is a classical FFT expanded with a time axis. The 3D-plot provides a new view to your spectrum as it can observed over time. The third axis emphasises small peaks above the noise floor. These small peaks can easily be missed in a 2D-plot in particular when these small peaks emerge and disappear over time. The figure illustrates this effect clearly. The waterfall shows the spectrum of a tuning fork 28secs after triggering it. The plot obviously shows that the oscillations at 881 Hz and 1320 Hz disappear and re-emerge over time.
Learn more about the analysis module waterfall in the eddylab video waterfall